Regional Carbon Capture Initiative State Fact Sheets
I conducted an extensive analysis of US Greenhouse Gas emitters, assisted in identifying key opportunities for carbon capture deployment, and designed the layout and graphics for a series of state fact sheets, distributed to key regional and national stakeholders.
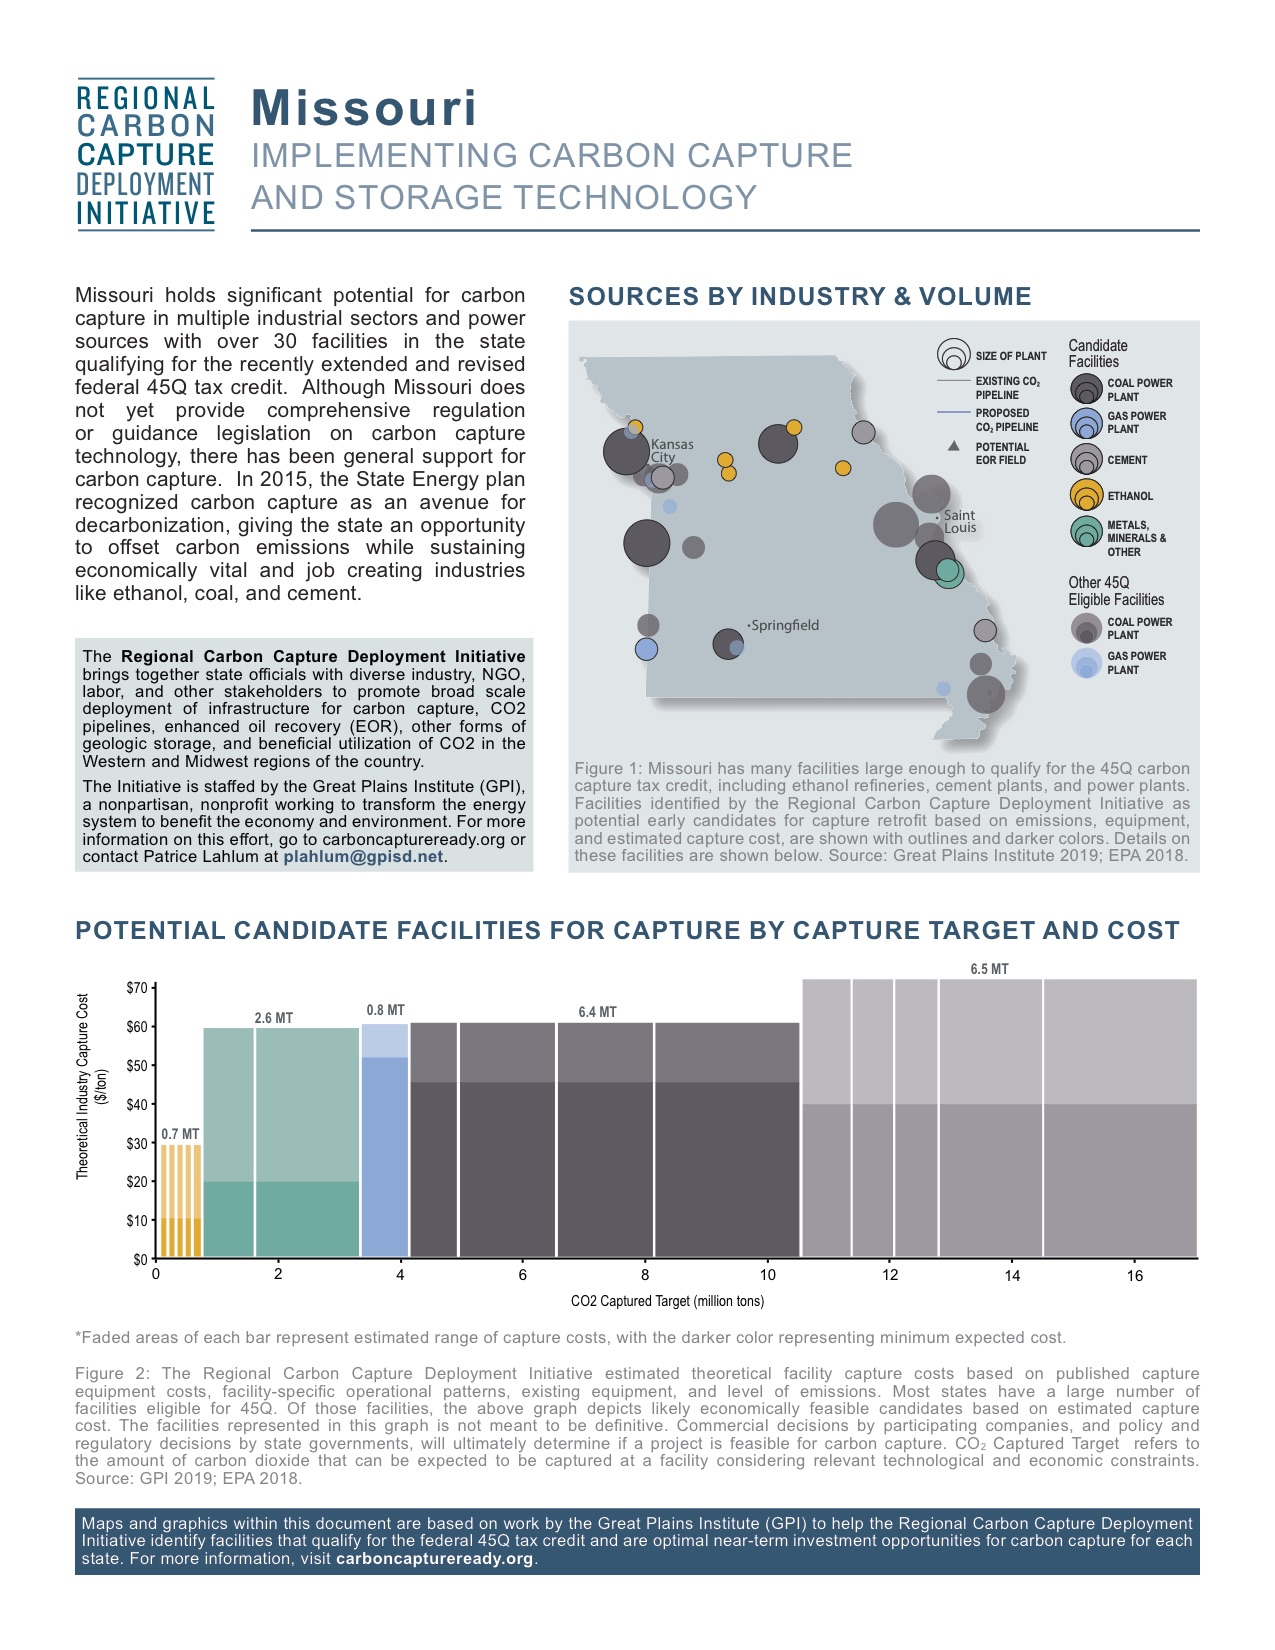
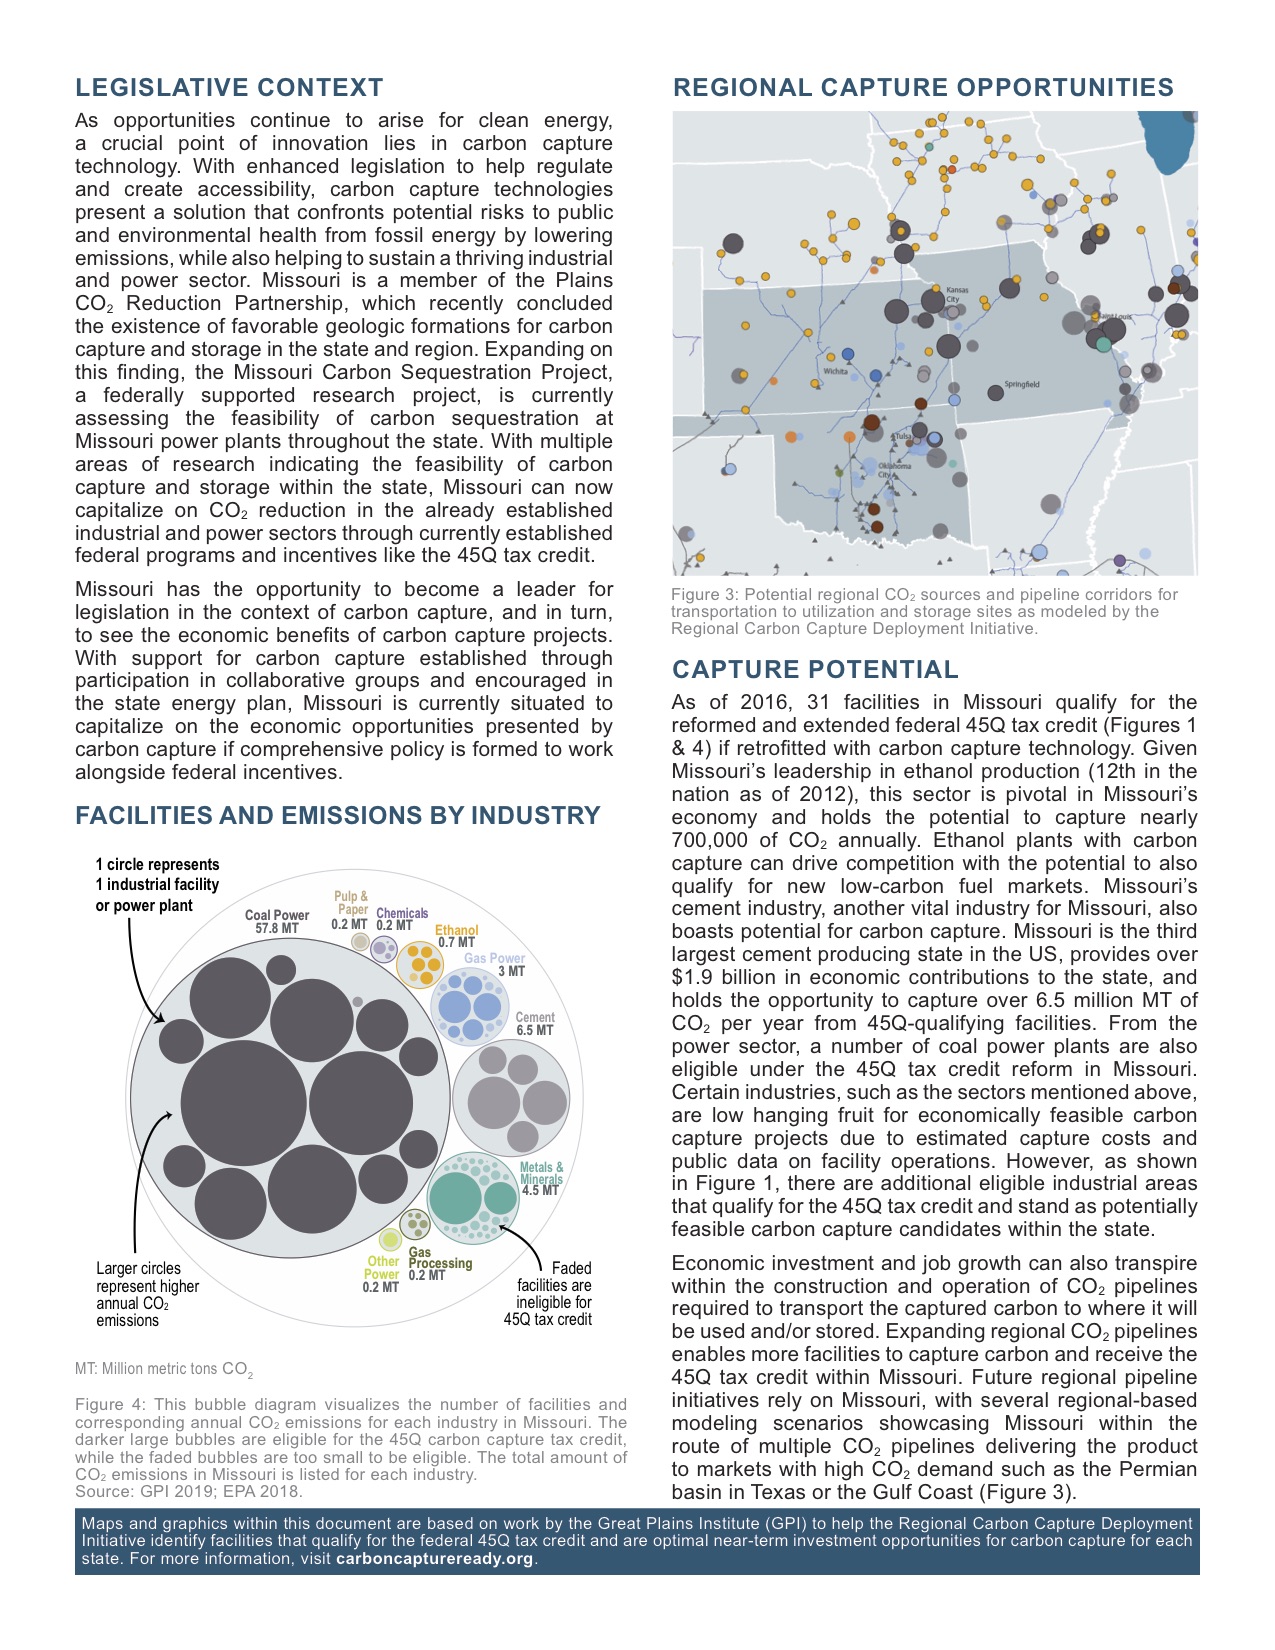
Through an iterative design process and collaboration with the rest of the Great Plains Institute’s Carbon Management Team, I created customized graphic carbon capture profiles for several US states, displaying current emissions conditions and highlighting prime opportunities for states to take action on carbon capture deployment.
To create the maps and graphs in these state profiles, I synthesized inventories of every major emitting industrial and power facility in the nation, using Microsoft Access to join and manage extensive databases, and using Microsoft Excel to organize and screen facilities for carbon capture viability. This analysis and resulting fact sheets are part of a broader project to model an economically and politically viable strategy for nation-wide carbon capture deployment in the United States.
Fact sheets like this one will periodically be uploaded to the carbon capture section of the Great Plains Institute’s website as more fact sheets are finalized and as more states become involved in carbon capture deployment efforts. The web version of this state profile is also available.
This project allowed me to take a lead role in defining a visual style for regional carbon capture communications materials. I used Adobe Illustrator and Adobe InDesign to create these materials.