Spatial Analysis and Information Design: Tracking Bike and Pedestrian Danger
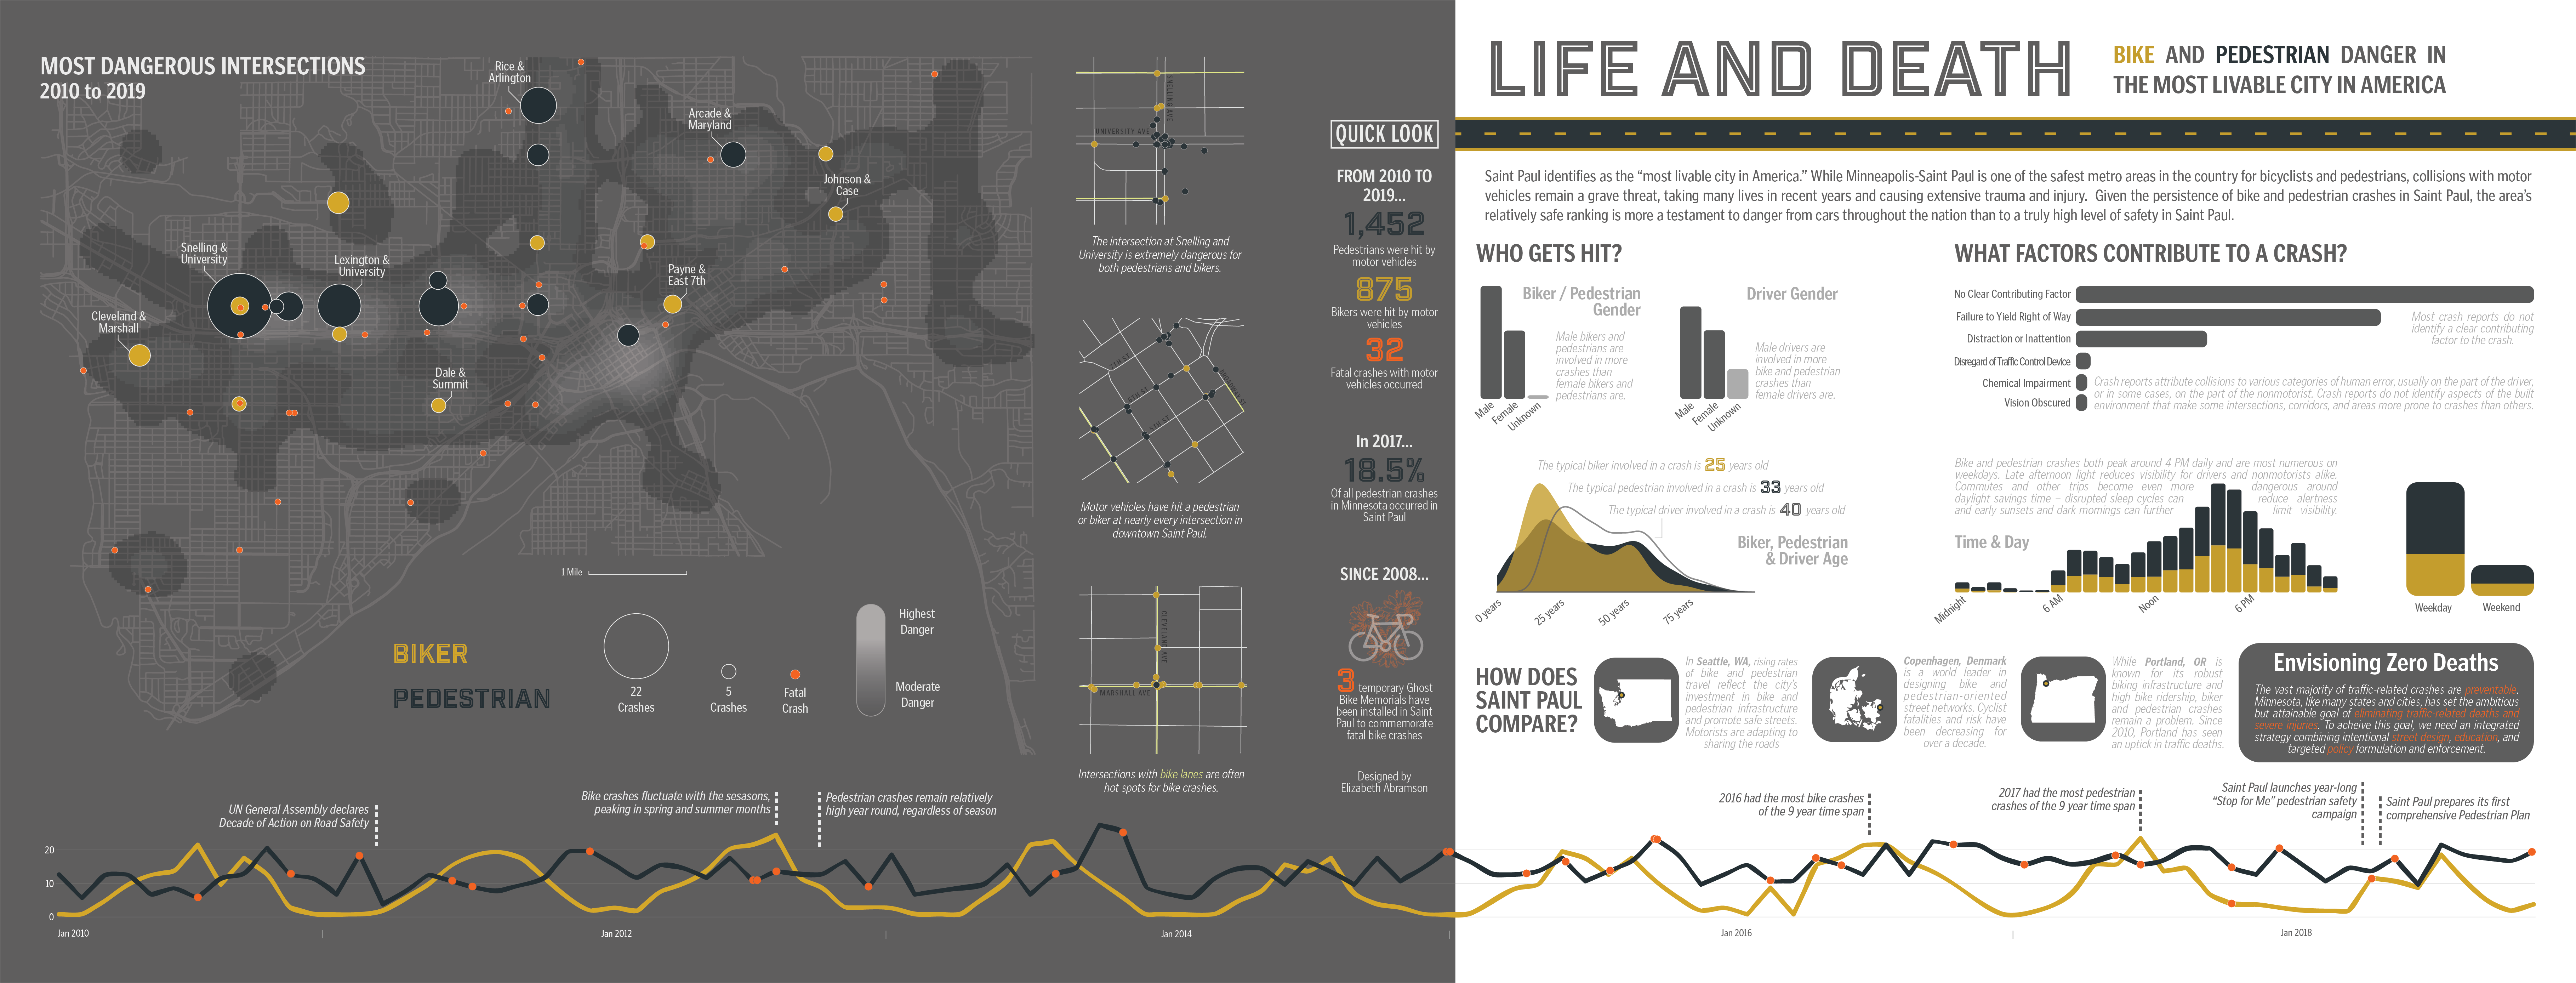
I analyzed nearly a decade of bike and pedestrian crashes to provide insight into crash factors and consequences in Saint Paul, MN.
During the Spring semester of my Senior year, I collaborated with 17 classmates to create a “Cultural Atlas” of Saint Paul.
Drawing inspiration from other data-driven atlases such as London: The Information Capital and Portlandness: A Cultural Atlas, I set out to shed light on an aspect of Saint Paul that I care about deeply, using spatial analysis and effective data visualization.
Our atlas was printed in hard copy and is also available to view online in its entirety. You zoom in on the details of my spread on pages 38 and 39 and learn more about the impetus for my spread on page 45.
It was a true pleasure to collaborate on this atlas with my many talented classmates — taking each of our individual spreads from concept to fruition and putting all the pieces together for our final publication.
I integrated several types of software to create my spread. I used ArcGIS Pro to identify Saint Paul’s most dangerous intersections and to visualize areas of highest crash density across the city. I used RStudio to compile, clean, and wrangle my data, to calculate crash statistics, and to create the basic elements of my graphs and timeline. I then exported my GIS map elements and RStudio graphics into Adobe Illustrator to give them a cohesive visual style and to integrate other textual and visual elements.